Today I used gnuplot to plot the Fourier series expansion for
x^2 from -pi, pi. I adapted some gnuplot scipt I found in the PDF docs for gnuplot online here:
gnuplot docs, that will plot fourier series
I just had to adapt the plotting from the docs - Here is the plot I made:
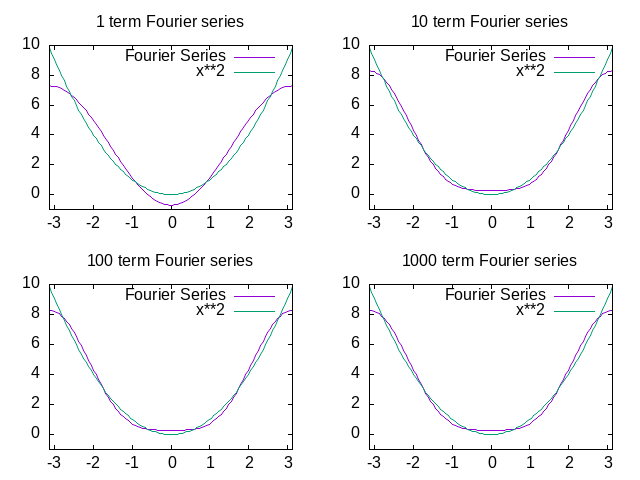
and below is the script I used
set terminal png
set output 'fourier.png'
set multiplot layout 2,2
set xrange [-pi:pi]
set yrange [-1:10]
set key on
fourier2(k, x) = (4*((-1)**k)/(k**2)) * cos(k*x)
do for [power = 0:3] {
TERMS = 10**power
set title sprintf("%g term Fourier series",TERMS)
plot ((pi**2)/3) + sum [k=1:TERMS] fourier2(k,x) title "Fourier Series", x**2
}

unset multiplot
unset output